LeaderOps360 Closed-Loop Leadership Execution
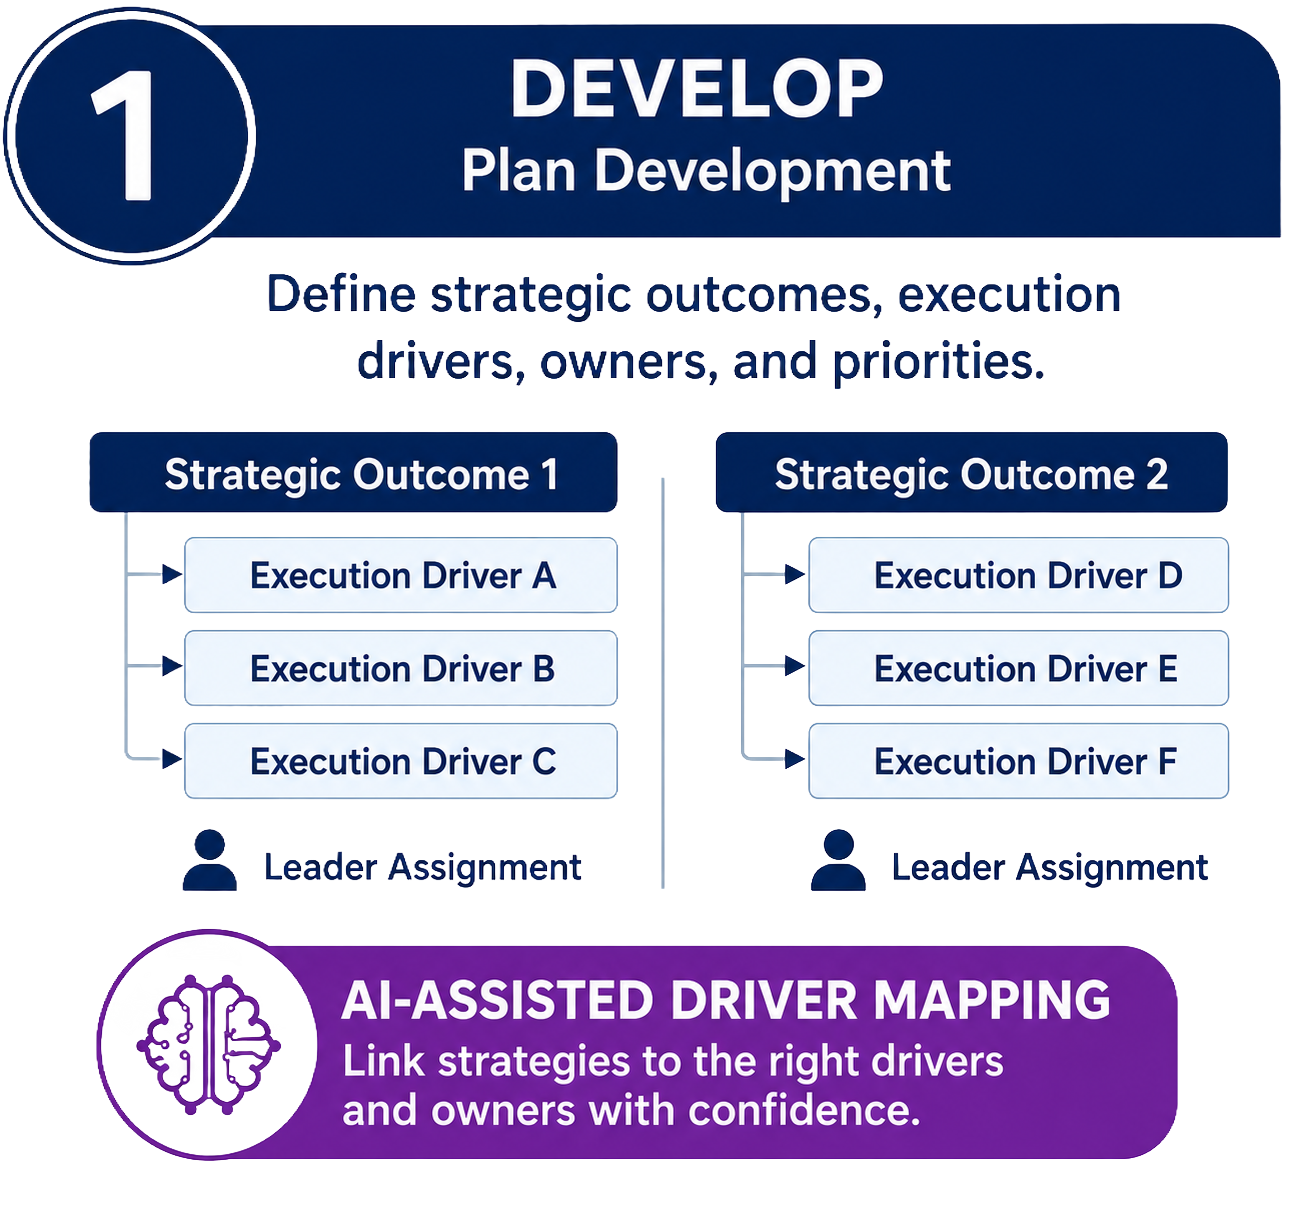
Flowchart showing plan development process, emphasizing defining strategic outcomes and linking strategies to execution drivers, with a section on AI-assisted driver mapping for confidence in strategy alignment.

From Plan to Performance to Learning - A Continuous Cycle of Improvement
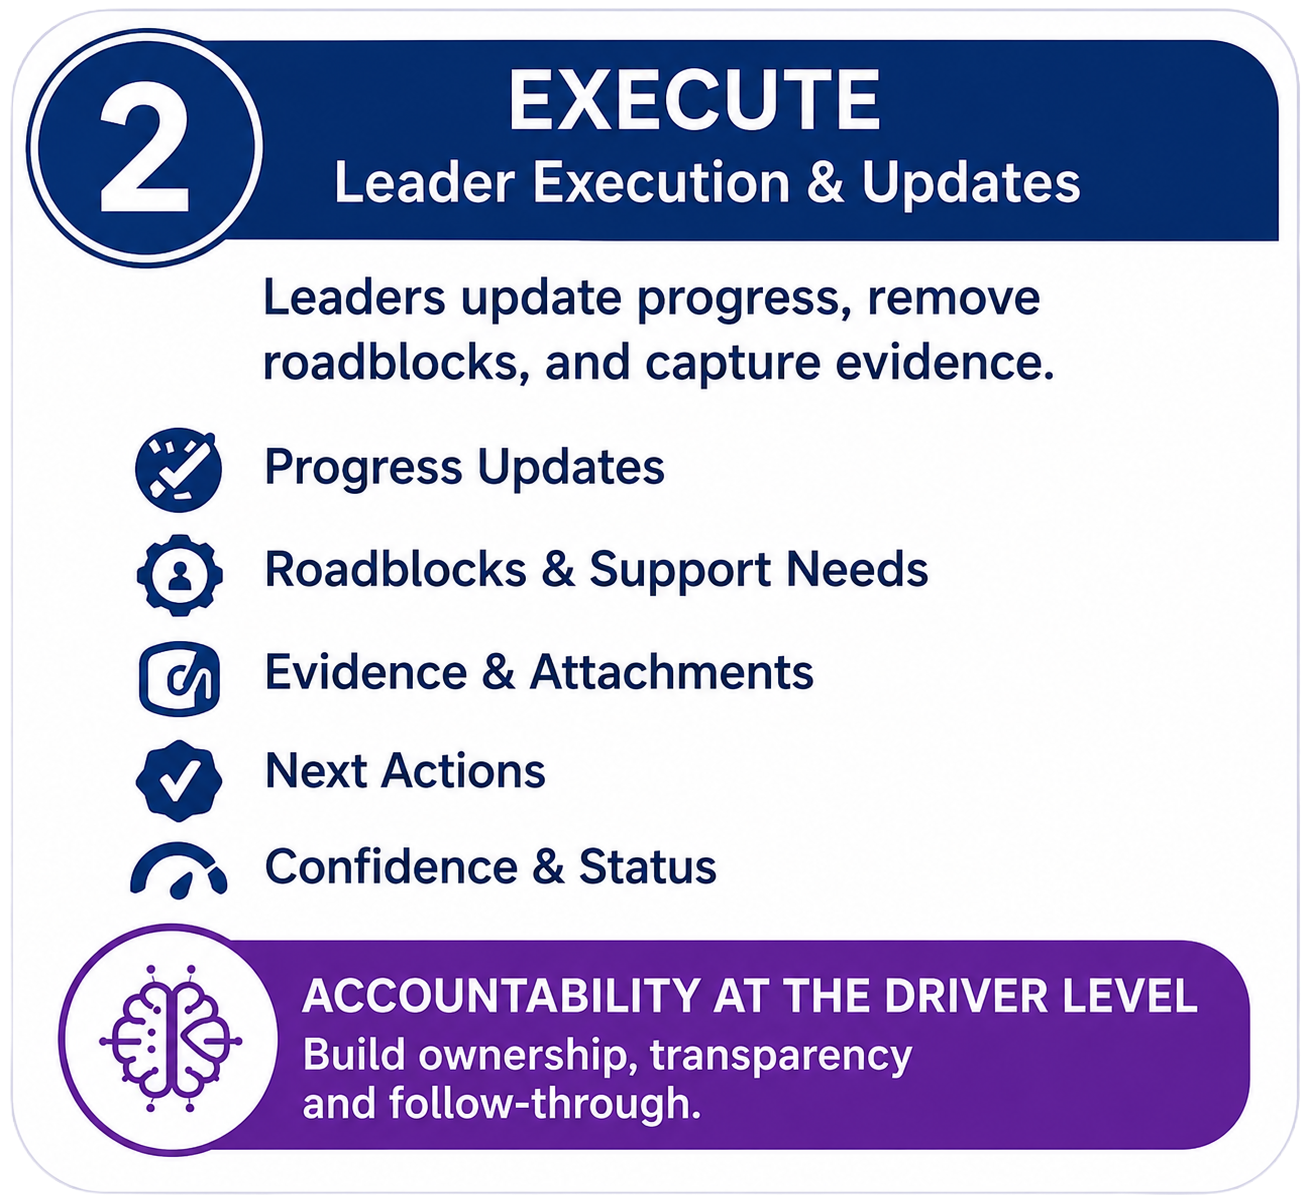
A digital graphic with a blue and purple theme titled 'EXECUTE Leader Execution & Updates.' It includes icons and text outlining steps for leader updates, progress, roadblocks, evidence, next actions, and confidence. A purple section at the bottom emphasizes accountability at the driver level with a brain icon and additional guidance.
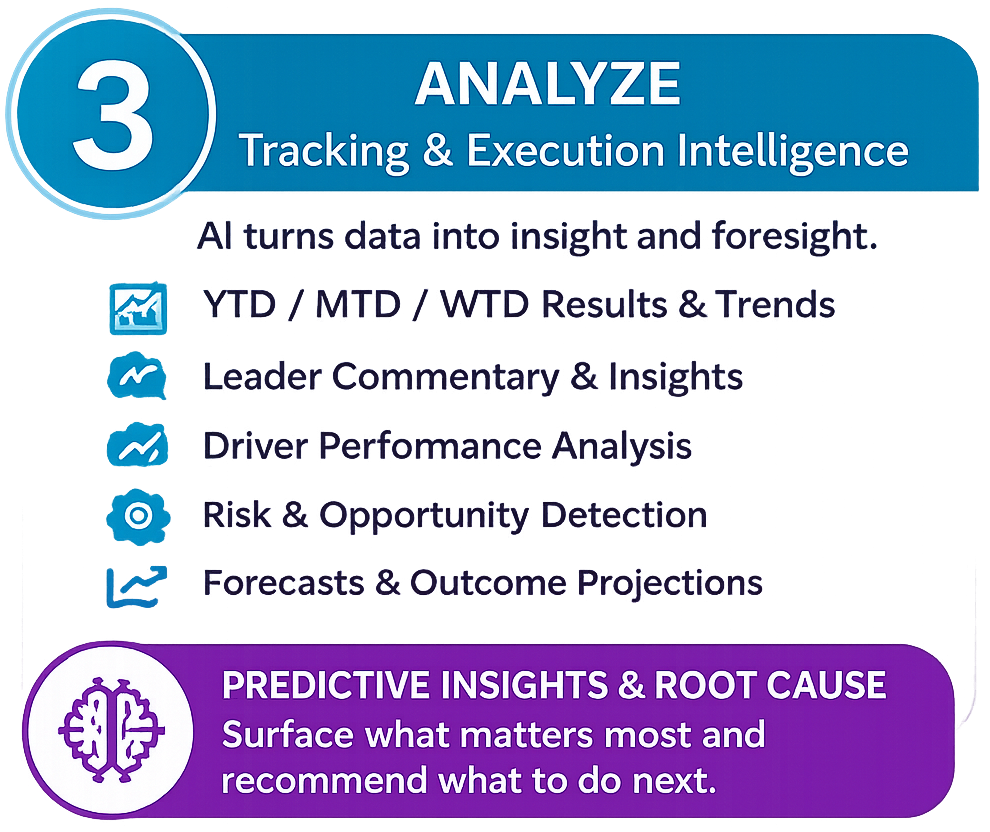
A graphic titled 'Analyze Tracking & Execution Intelligence' with a list of analytics topics and a section labeled 'Predictive Insights & Root Cause'.
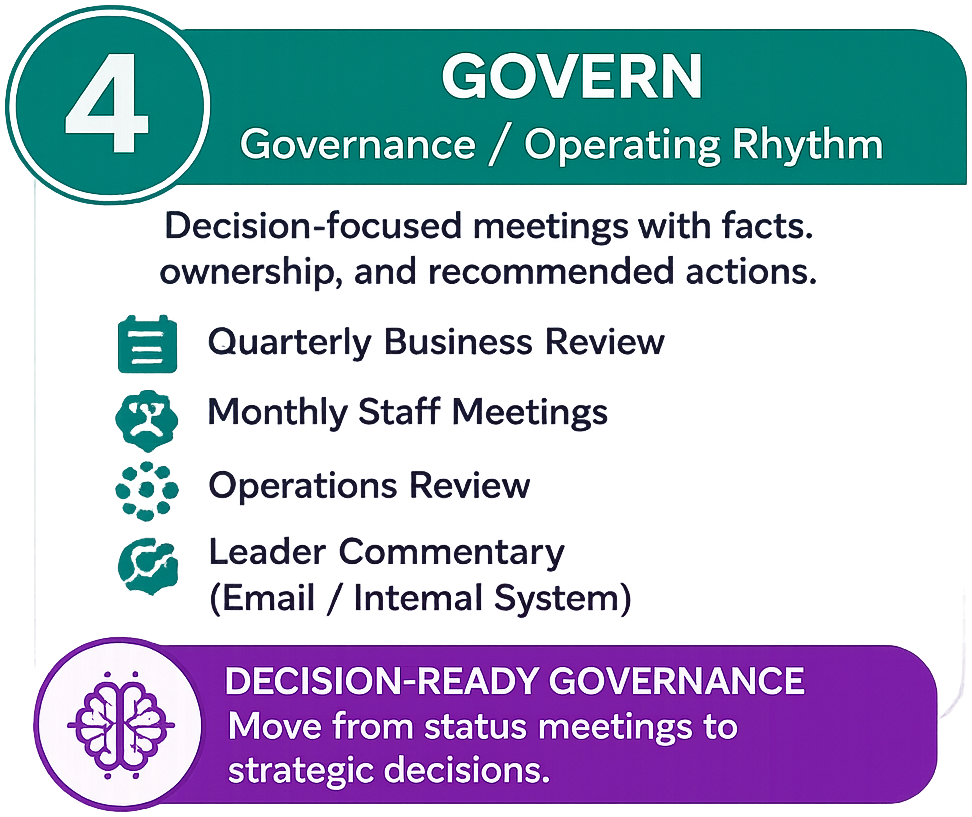
A digital slide presentation on governance, highlighting decision-focused meetings, quarterly business reviews, monthly staff meetings, operations reviews, and leadership commentary via email or internal systems, with a section on decision-ready governance emphasizing moving from status meetings to strategic decisions.
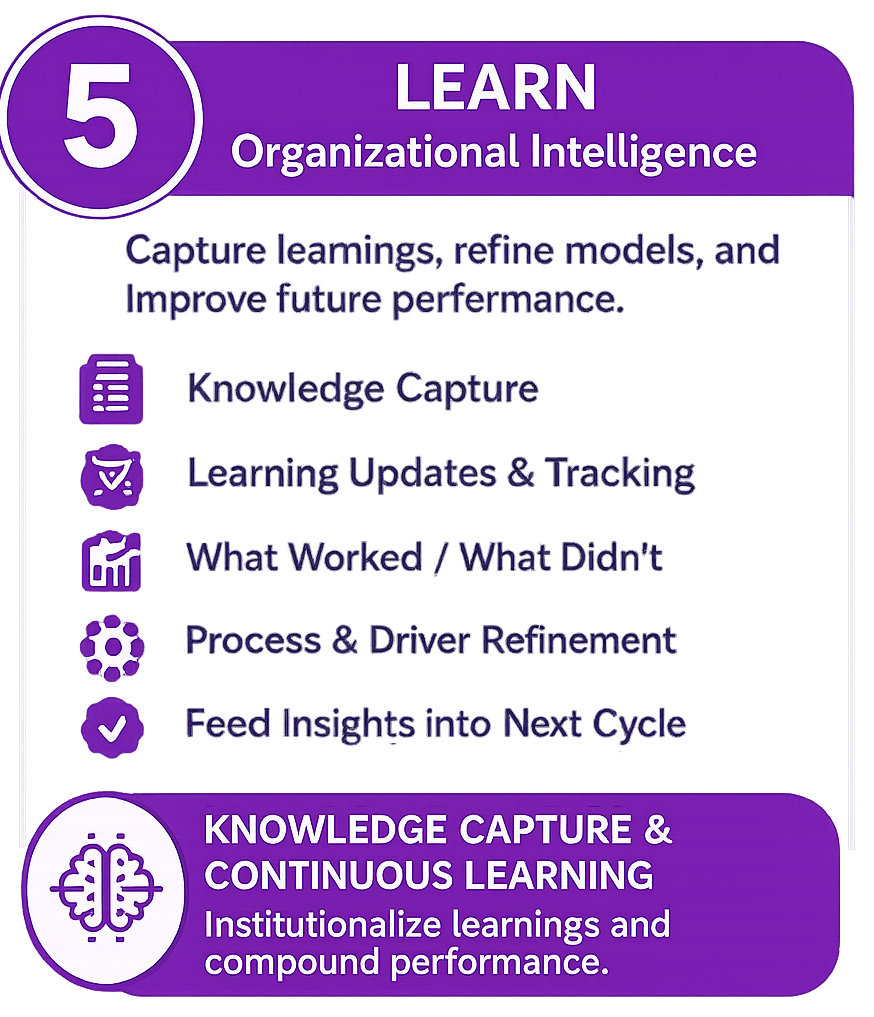
Diagram about organizational learning with steps: knowledge capture, learning updates and tracking, evaluating what worked and didn't, process refinement, and feeding insights into the next cycle, emphasizing knowledge capture and continuous learning.
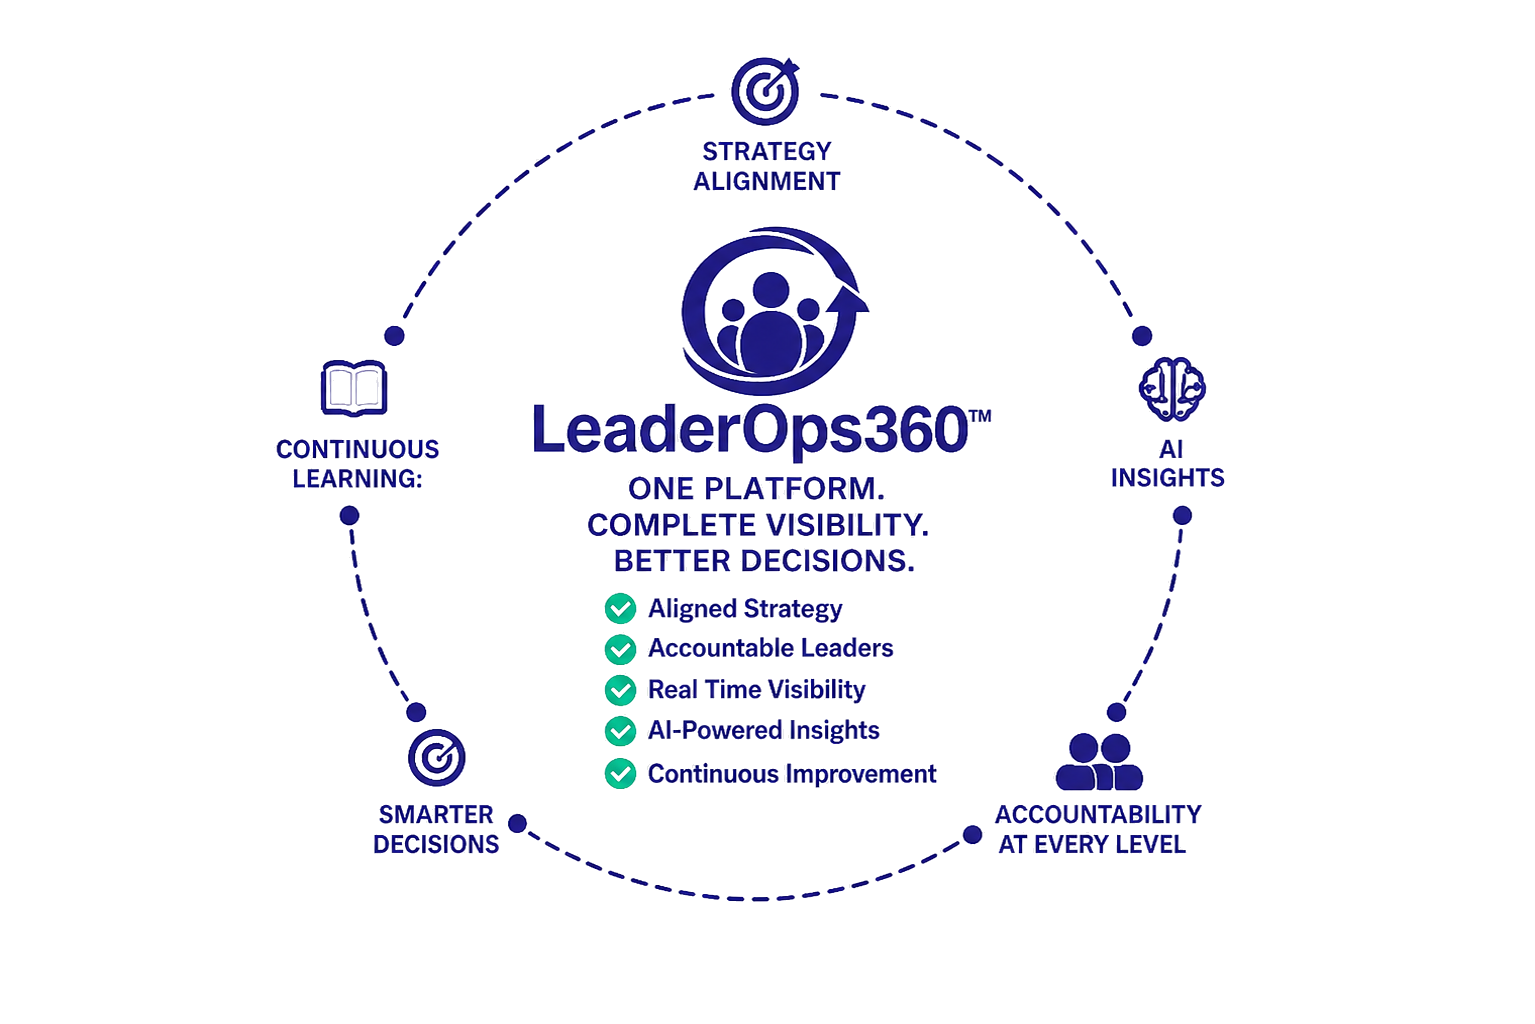
Graphic for LeaderOps360 depicting a central icon of three figures and text promoting platform features like strategy alignment, continuous learning, AI insights, accountability, and smarter decisions.
Infographic titled 'How Leaderops360 Changes the Game' with five icons and descriptions. The icons include a feedback loop, a person with chart, a brain with data, a group of people, and a bar chart. The descriptions highlight feedback cycles, ownership, AI insights, decision-making, and continuous learning.
A large purple arrow pointing downwards, overlapping a dark background with some colorful glitch-like artifacts.
A diagram illustrating a wave or flow proceeding from left to right, with color coding indicating different intensities or parts of the wave in purple, blue, yellow, and green.
A purple arrow curving upward with a pointed tip.
A purple curved arc or line against a black background.
Purple curved arrow pointing upward with a 3D effect.
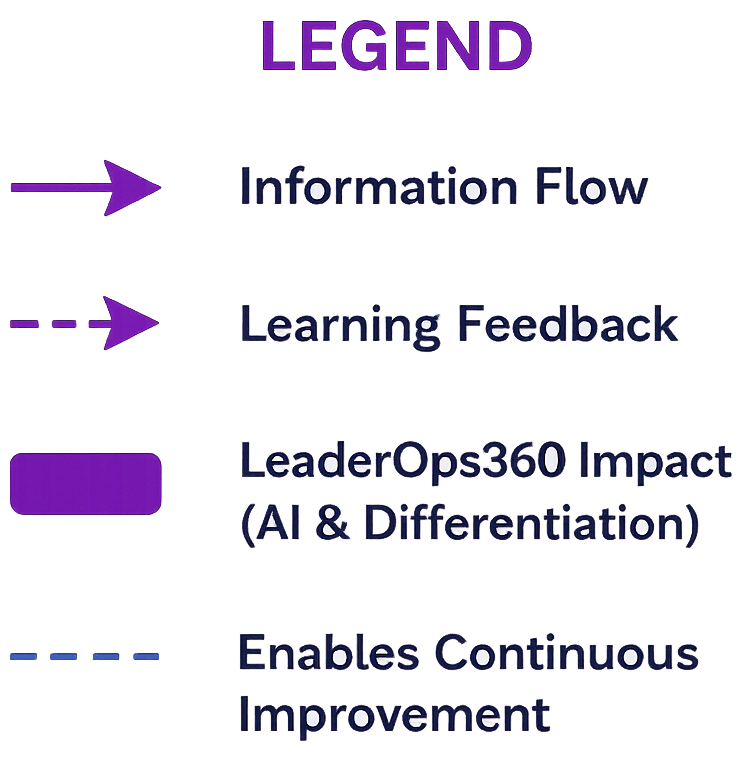
Diagram illustrating a process for leadership development, including stages such as information flow, learning feedback, leader impact with AI and differentiation, and continuous improvement.

Close the gap between strategy and execution

Start free with one team. Expand to the enterprise when you’re ready.

60-day free trial · No credit card required