Everything you need to run execution

From strategic planning to real-time risk — in one platform, no stitching tools together.

Strategic Outputs

Icon of a person with a gear in their head, representing thinking or problem-solving.

Define the measurable commitments your organization makes each period across every domain.

Execution Drivers

A black silhouette of a pig with curly tail, standing on four legs, facing left.

Weight the activities driving each output so it's clear which lever carries the most responsibility.

Update Actuals

Silhouette of a person sitting on a bench, next to a tree, with a bicycle nearby during sunset

Enter results period by period. Red/yellow/green status updates instantly across the board.

Leader Check-Ins

An illustration of a magnifying glass examining a globe, symbolizing global search or exploration.

Capture the "why" behind the numbers, kept separate from the hard data.

Tracking & Analytics

An illustration of a black martini glass filled with a drink, garnished with an olive on a toothpick.

Executive dashboards, driver-impact analysis, and at-risk output tables.

Governance & Cadence

A vintage illustration of a woman holding a bouquet of flowers in a decorative vase, dressed in historical clothing.

Build review rhythm into the platform with compliance tracking and nudges.

WHAT MAKES IT DIFFERENT
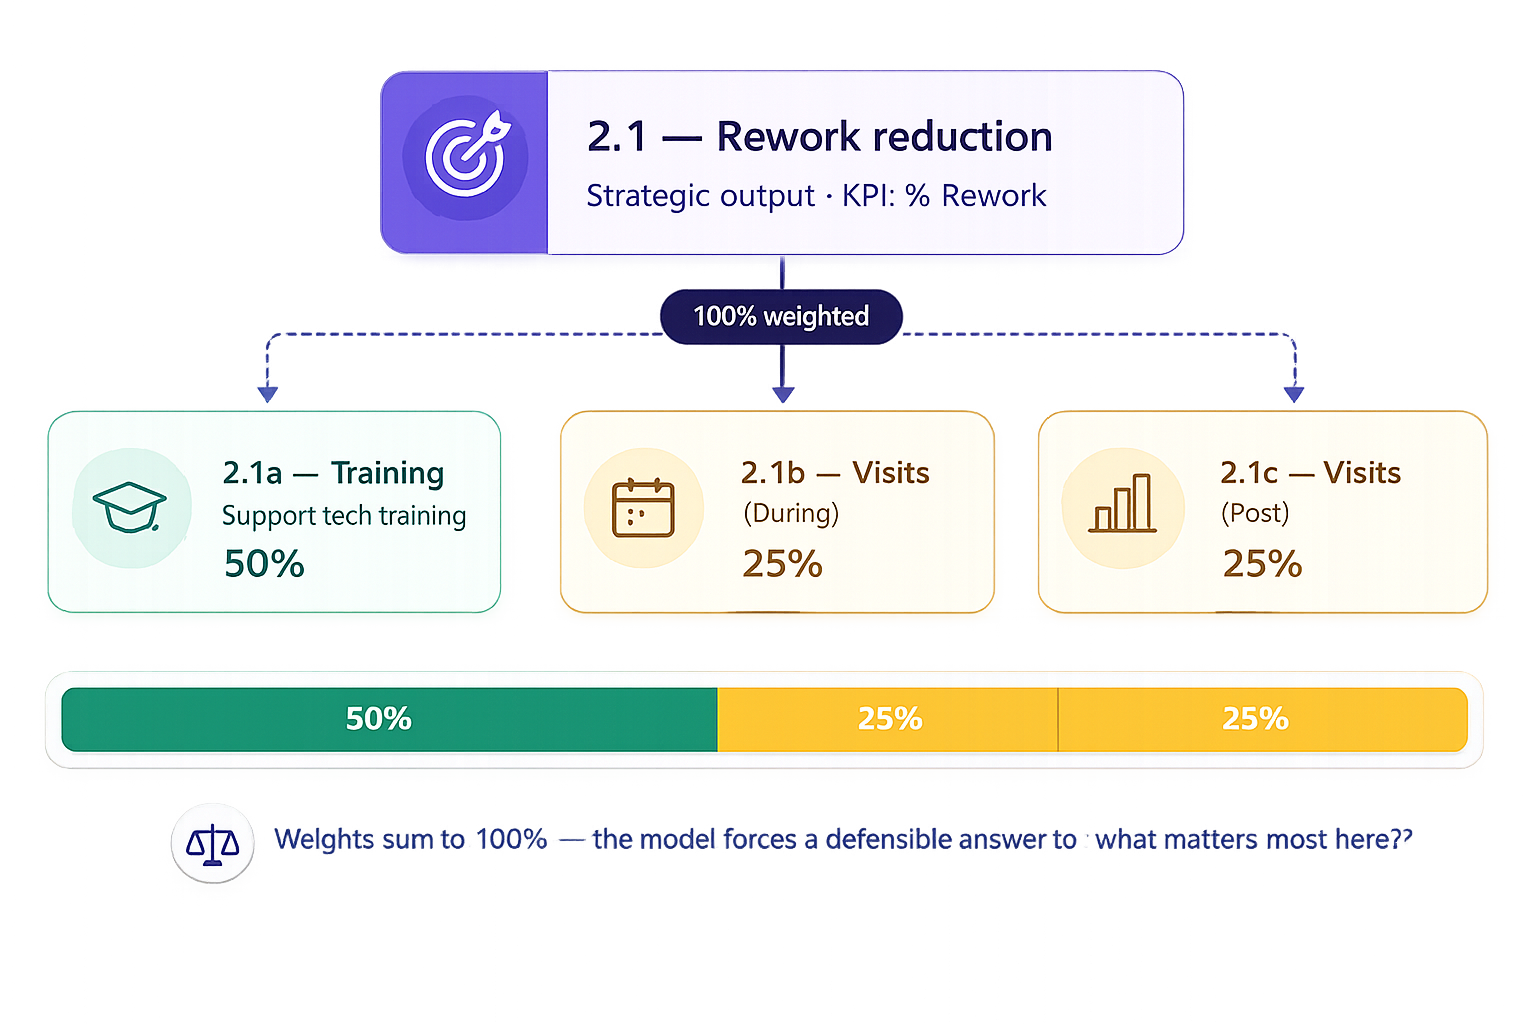
A presentation slide titled '2.1 - Rework reduction' showing a support structure with three main parts: 2.1a supporting tech training at 50%, 2.1b visits during at 25%, and 2.1c visits after at 25%. A color-coded bar below indicates 50%, 25%, and 25% proportions. Text at the bottom mentions weights summing to 100%, emphasizing model balance.

Every driver gets a percentage weight reflecting its influence on the parent output, and all weights sum to 100%. This forces clarity about what matters most and makes the risk calculation transparent — defensible to the board, the CFO, and the frontline alike.

Weighted drivers connect activity to outcomes

Reporting for every layer
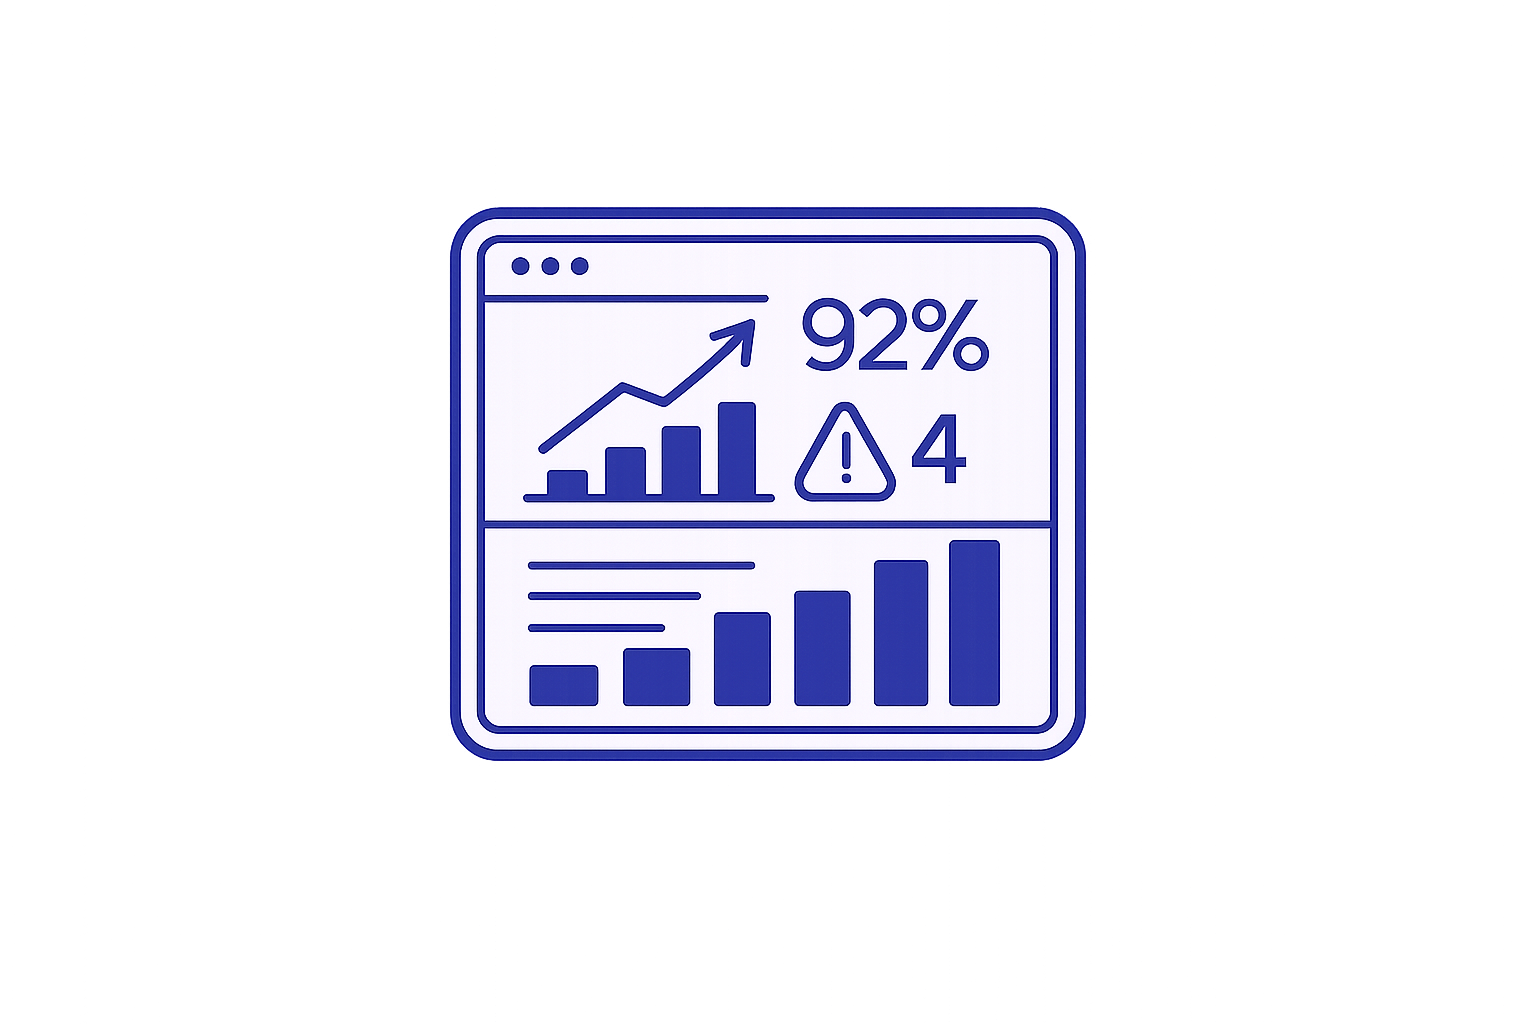
Digital dashboard showing upward trending bar and line graphs, 92% figure, a warning exclamation mark with the number 4, and placeholder text.

C-Suite / Executive Reports

Org-wide performance, risk, and check-in compliance for board-level conversations.

Illustration of a building with data charts and graphs.

Departmental Reports

Business-unit performance measured against the plan.

Digital cartoon profile badge with user icon, the number 87, bar graph, target icon, upward trend line, shield icon, and star icon.

Individual Scorecards

Each leader's own outputs, drivers, and risk exposure.

A digital illustration of an inflow and outflow system with arrows pointing right for 'IN' and right for 'OUT', connected by lines and nodes representing data or process flow.

I/O Linkage Reports

The modeled relationship between drivers and output results.
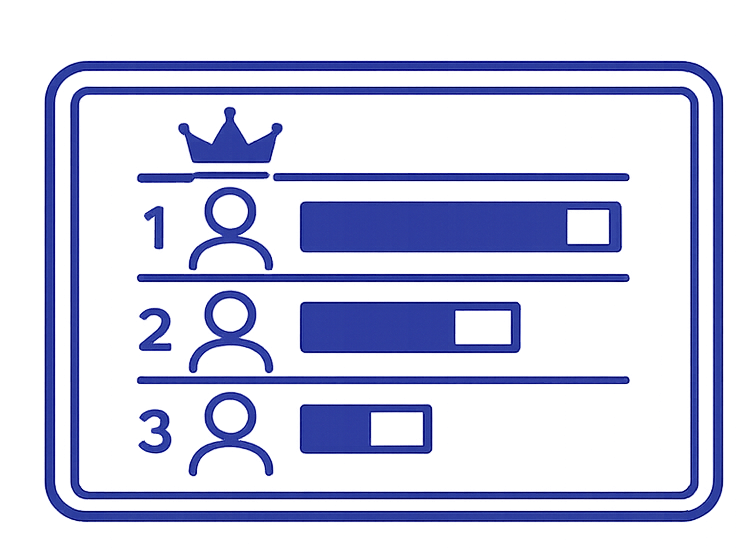
A digital voting scoreboard displaying three candidates, with the top candidate marked as a winner with a crown icon. The second place has a smaller bar, and the third place has an even smaller bar, indicating their respective vote counts.

Stacked Ranking

Compare leaders and business units on shared metrics.

A clipboard with a checklist and three checkmarks, accompanied by an alert triangle with an exclamation mark.

Compliance Reports

Who has and hasn't completed their check-ins.

Built to get smarter

LET US PARTNER WITH YOU

A black silhouette of a person walking and holding an umbrella.

AI Insights Engine

Automated risk narratives, predictive run-rate analysis, and AI-guided input design.

A black silhouette of a pig, facing right, with a curly tail and four legs

Financial Impact Modeling

Translate execution gaps into dollar-value estimates.

A black silhouette of a woman with long hair sitting at a desk, looking at a laptop, with a small plant and a cup nearby.

API Connectors

Auto-populate driver metrics from your existing systems.

Put your strategy to work